Widgets
Introduction
Motadata being an analytical platform has a rich set of widgets to do many operations on the data and analyze the performance of the system. Widgets represent the data in form of the graphs, chart and metrics. Motadata uses the widgets everywhere in the application to see the overall performance of each entity. Users can use widget to look into specific information and see them in their dashboard and reports.
Why to Use Widgets
Widgets are the source entities that allows you to analyze your network in different aspects. Along with these, Motadata widgets has following additional key features: * You can manage the widgets on run-time and change how the data is aggregated. * You can export the widgets in PDF, excel and as image. * You can create personal reports and dashboards with specific widgets. * You can duplicate a widget and use it at different places.
Structure of Widgets
Based on where the widgets are available, Motadata uses following structure:
Fixed Structure
The fixed widgets show the high level information of different components in your network. These widgets are fixed on a page and shows a specific output type. You can however use the filters to change the name or select the source, tag and monitors.
Fixed Widgets on Home Page
These widgets are available on the home page menus: Overview, Health Statistics and Network Interfaces; Motadata Health Component (See header bar); and Flow Visualization.
Default Widgets
Motadata provides you a pre-defined set of widgets to capture the important and most frequent analytics of the network. Motadata groups the similar widgets and uses a template to recognize the group.
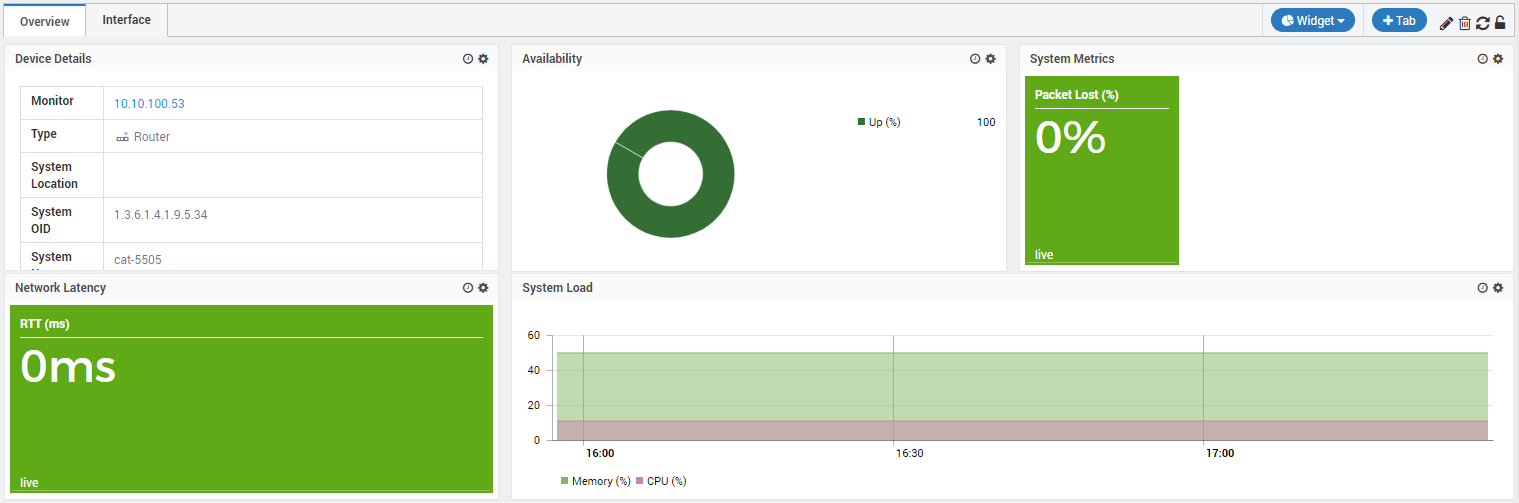
Default Widgets on Monitor Detail Page
You can use the widgets as they are or you can tweak them to derive different information. Default widgets already has most of the information so you don’t need to start from the scratch. These widgets are available in the Dashboard, Monitor’s detail page and in reports.
Custom Widgets
With custom widgets, you can look at the aspects of the monitors that are not available by default. Custom widgets allow you to select the source and parameters right from the beginning and choose the desired output.
Custom Widgets in Report
Similar to default widgets, custom widgets are available in the Dashboard, Monitor’s detail page and in reports.
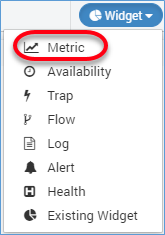
Widget Categories
Motadata has different categories of widgets to capture the different aspects of data. A widget category helps you understand what kind of information the users can expect as an output. For example: a ‘Health’ widget shows information about the health of the monitors. The widget categories available in Motadata are:
Widget Category List
Metric: It is a general category that supports all type of analytical data. There is no restriction on the input and output parameters.
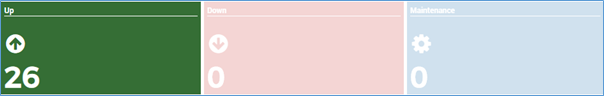
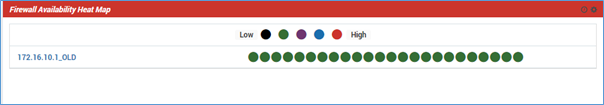
Availability: This category shows the monitor’s availability status i.e. up, down, maintenance, unknown, etc.
Trap: This category shows analytics of the trap data.
Flow: This category shows analytics of the flow data.
Log: This category shows analytics of the log data.
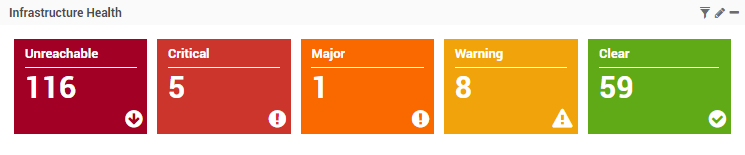
Alert: This category shows the count of the alerts fired in last poll.
Heath: This category shows the count of the monitors based on their severity in last poll.
Existing Widget: This category lets you use an existing widget to create a new widget. Here, you can clone the widget and tweak it for a different output.
Business Service: This category shows you the health of the business service i.e. clear, critical or none.
Types of Widget
Widgets are of many shapes and size. How a widget looks depend on the type of the widget. A type of the widget is nothing but how the output is generated. You will find that Motadata shows widget types based on the category selected. On a high level note, the widgets are of following types:
Gauge: A gauge widget simply shows the count of the analytical data. Motadata uses information from last poll and show in this type of widget.
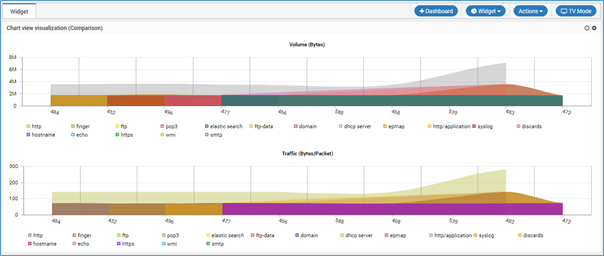
Historical: Historical widget shows the historical data of all the monitors in a given interval of time. This widget is generally used for comparison among different monitors.
TopN/LeastN: This widget shows the information of top and minimum performing monitors in a given interval of time. You can create graphs to quickly identify which monitors are consuming maximum resource.
Grid: This widget shows the information in form the grid. It’s a simple tabular format grouped by the monitors or event times.
List: When there is only one parameter, this widget shows the information in form the list.
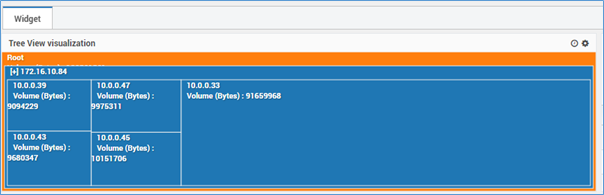
Tree Map: The widget shows the information in form the hierarchy (tree).
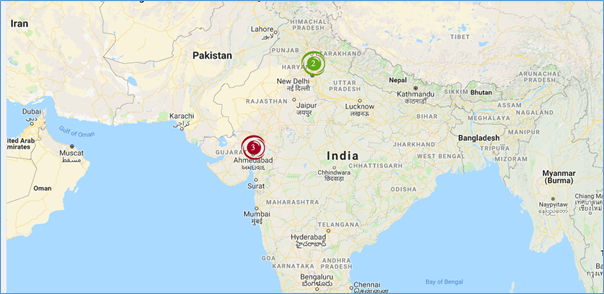
Map: This widget shows the information in form of the google map. For this, you’ll need the Google Map’s API key first.
Chart: This widget shows the information in form the chart/graph.
Log: Shows the log/flow/trap messages in rows.
Create Custom Widget
You can create a new widget from: Dashboard, Monitor’s Detail Page and Report.
Create Custom Widget
Select the Template
Templates are the pages/placeholders that contains the widgets. Motadata provides a default range of templates with default range of widgets in each. Whenever you create a new widget, it is assigned to the template opened on your screen.
Note: select the correct template before creating a new widget. You cannot change the template of the widget.
Select Widget Template
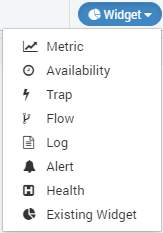
Select Widget Category
Select a widget type to create the widget. Each widget type has a specific set of the configuration parameters and visualization output.
Note: DO NOT forget to select the correct template for the widget. You cannot change the template afterwards.
Select Widget Type
From the left hand side column, select a widget type. If you are not sure which type should you use, simply navigate through all the available types and see what visualizations they are providing.
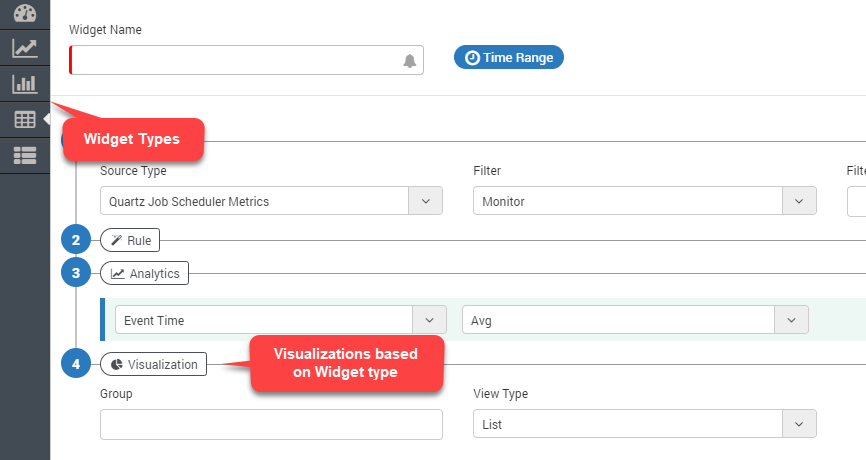
Select Widget Type
Define Demographic Details
Widget Name
Type the widget name. You’ll recognize the widget using this name. Please keep a meaningful and unique name so you don’t get confused with other similar widgets.
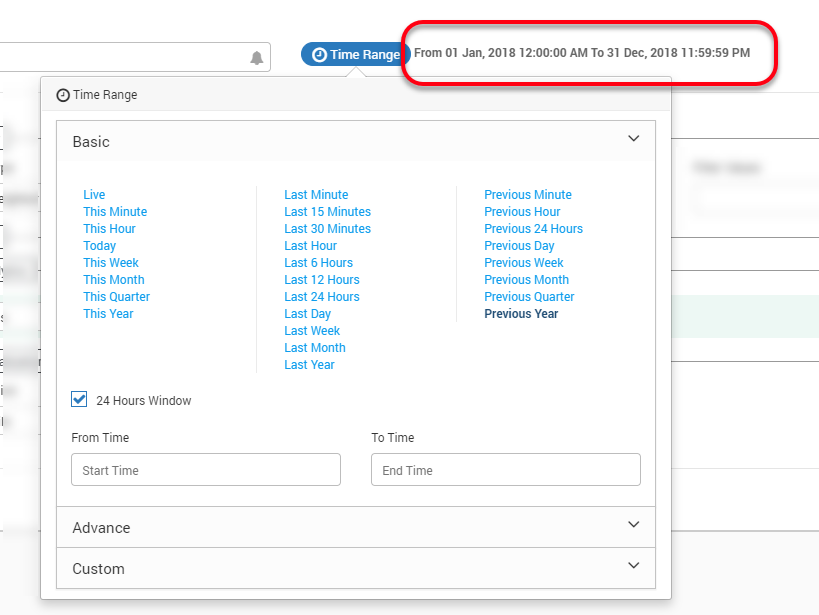
Time Range
(Not Available for All Widgets) When you select a time range, Motadata looks into the records for that time period and show the output. This feature is useful when you want to look the data of a particular time (say today). See last section to understand how Motadata computes using time range.
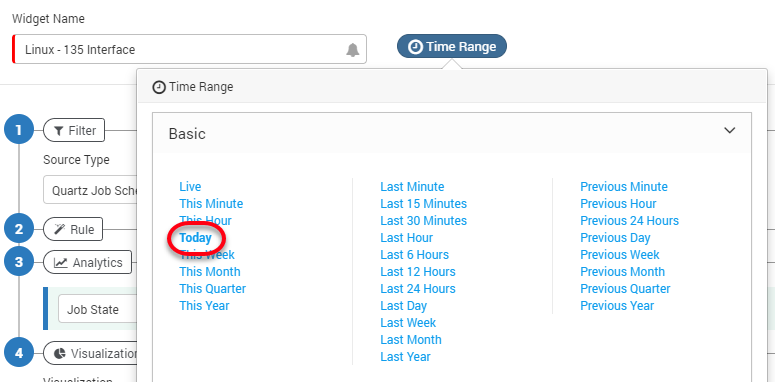
Select Time Range
Define Condition Filters
With filter conditions, you can define what monitor(s) or data you want to see in the widget. The filters available for a widget are dependent on the widget category selected.
Source Type
Source type is available for: Metric, Trap and Log categories. The drop-down values in the source type shows following type of values:
In Metric widget category, Motadata shows list of all metrics available in the system.
In Trap widget category, Motadata shows ‘Trap’ as the source type.
In Log widget category, drop-down shows all the sources from which Motadata collects the log.
Select the desired source type for which you want to create a widget.
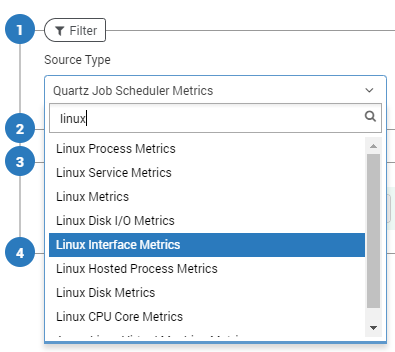
Select Source Type
Filter
Motadata uses a set of 5 filters to create the widget. However, for the Log and Trap categories, two filters: ‘Department’ and ‘Source Type’ are available. Filter decides how Motadata will identify the monitors of your selected source type. You can choose one of the following methods:
Tag - Use the monitor tags to find a monitor.
Monitor - Use the IP address to find a monitor.
RPE - Look for monitors polled by an RPE.
Department - Look for monitors of a given department.
Source Host - Use the IP address of source monitors from which logs and flow are coming.
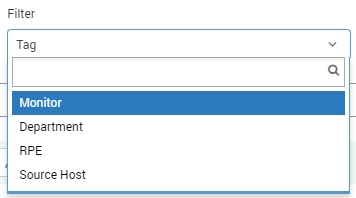
Select Filter
Filter Values
Motadata shows filter values based on the filter you have selected. The filter values work as follows:
Tags: When you select filter as a tag, the list shows all the tags available for that source type. Motadata will choose all the monitors of the selected tags for the widget.
Monitor: When you select filter as a monitor, the list shows IP address/monitor names available for that source type. Motadata will choose all the selected monitors for the widget.
RPE: When you select filter as a RPE, the list shows all the RPEs that are polling monitors for that source type. Motadata will choose all the monitors getting polled from the selected RPE for the widget.
Department: When you select filter as a department, the list shows all the Departments that are linked to the monitors for that source type. Motadata will choose all the monitors associated with the selected departments for the widget.
Source Host: When you select the source host, the list shows all the IP addresses for that source type. Motadata will choose all the monitors under that source type for showing widget output.
Blank: When you select nothing in the include drop-down (leaving it blank), Motadata will choose all the monitors for that source type.
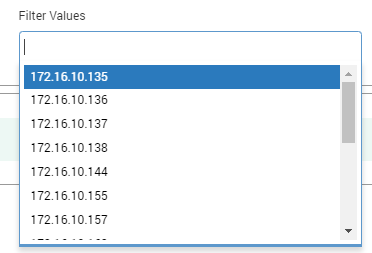
Select Filter Values
Instance Type
Available for Availability, Alert and Health category of widgets. The instance type can be:
None
Motadata will fetch information at the monitor level. For ex: you can check how many monitors are in ‘up’ ‘down’ or in ‘maintenance’ mode.
Interface
Motadata will look into the available interfaces of the monitor. For ex: A port of the network device. You can create a widget to show how many ports are in ‘up’ and ‘down’ mode.
Service
Motadata will look into the available services of the monitor. For ex: an application running in windows machine. You can create a widget to see how many applications are in ‘up’ or ‘down’ mode.
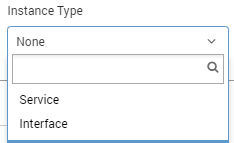
Select Instance Type
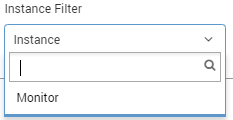
Instance Filter
Instance filter is available for: Metric, Availability, Alert and Health widget categories. It gives you a choice to select an instance for all the monitors or for a single monitor. The instance filter has two values:
Instance
It lets you choose the instance. Motadata will consider all the monitors having that instance.
Monitor
It lets you choose the instance of a monitor. Motadata will consider the selected instance of the selected monitor only.
Select Instance Filter
Define Filter Rules
Rules help you to create the widget with specific parameters of the monitors. You can select the rules if you want to add conditions for granular output. For example: you can create widgets whose CPU consumption is greater than 60%. To create such conditions:
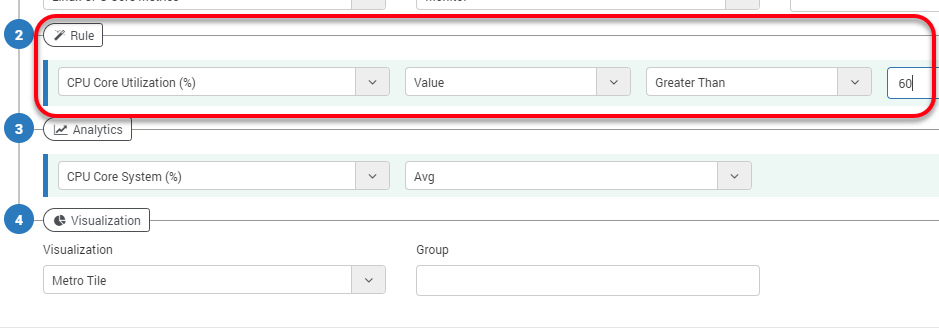
Define Filter Rules
Set Analytics
With analytics you can define the exact outputs of the widget. For example in a table widget, you can define the columns using analytics. Also, you can define how the values are calculated in the widget.
For the Linux monitors, Motadata has a default widget to show the system processes. The widget uses following visualization:
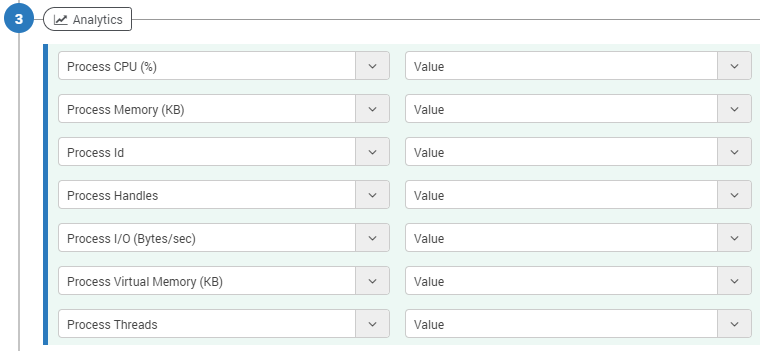
Set Analytics
Here is the output of the above analytics:
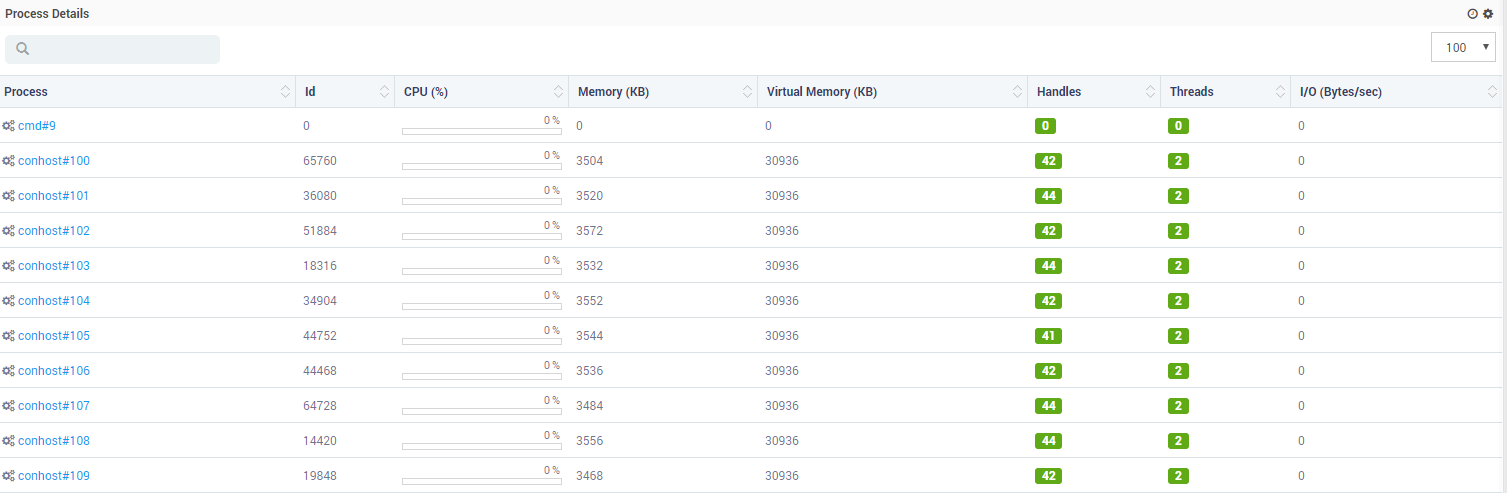
Output of Analytics
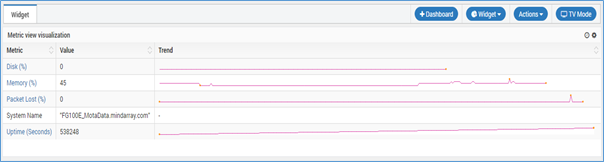
Set Visualization
Visualization gives you a range of graphs and charts as a display output of the widget. The visualization is based on the type of metric you have selected. For example: A default widget shows ‘Top 10 Linux Interfaces by OUT Traffic (Kbps)’. For this it uses following visualization:
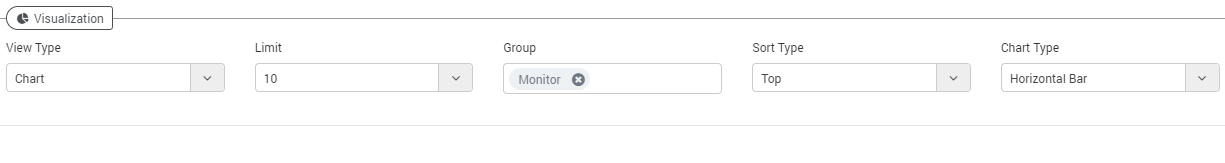
Set Visualization
The output of the above visualization is:
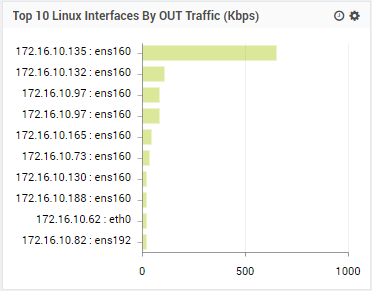
Set Visualization Output
Available widget visualizations are:
Gauge View
User can create a widget for getting data as per count, speed, traffic, (%) like this type of calculating the values of network device. It has following visualizations:
Metro Tile
Metro Tile
When the opacity is 0, the view will be greyed out (see pink and blue widgets). The greyed-out effect is available only on Motadata screen and not on exported files.
Cylinder Gauge
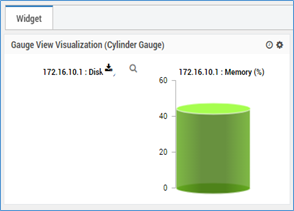
Cylinder Gauge
Angular Gauge
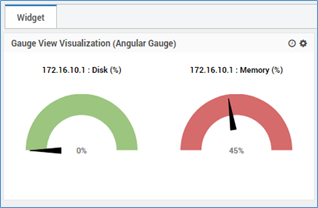
Angular Gauge
Extended Metro Tile
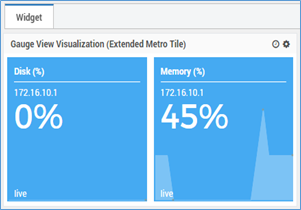
Extended Metro Tile
Historical View
Historical view widget is designed for getting the previous details of network devices data. Historical view has the following visualizations.
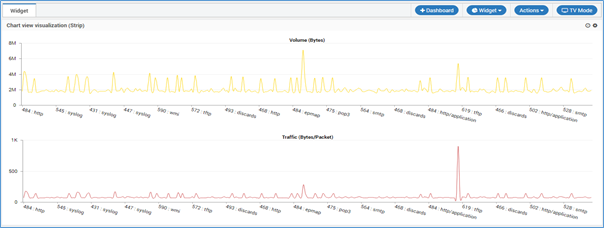
Strip View
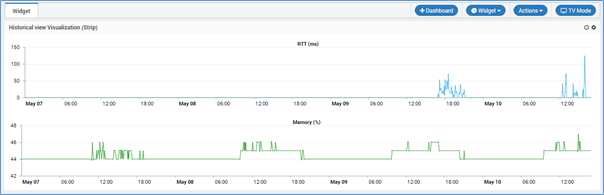
Strip View
Compression View
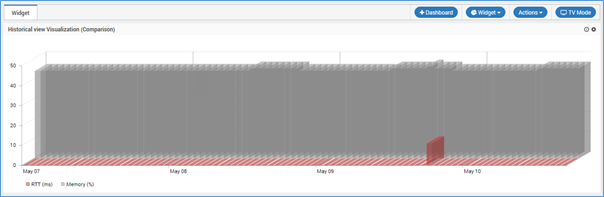
Compression View
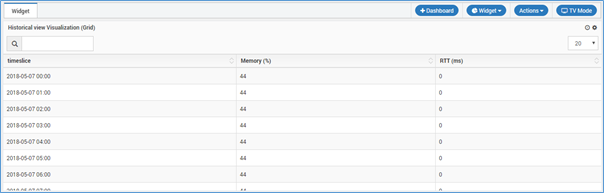
Grid View
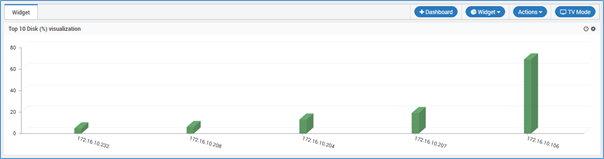
Top N/Least N
Top N/Least N widget are showing the Top or Least ordering data of the network device. Top N/Least N widget has different type of Chart type.
Line
Area
Horizontal Bar
Vertical Bar
Horizontal 3D Bar
Vertical 3D Bar
Pie
3D Pie
Donut
3D Donut
Top N/Least N View
Grid View
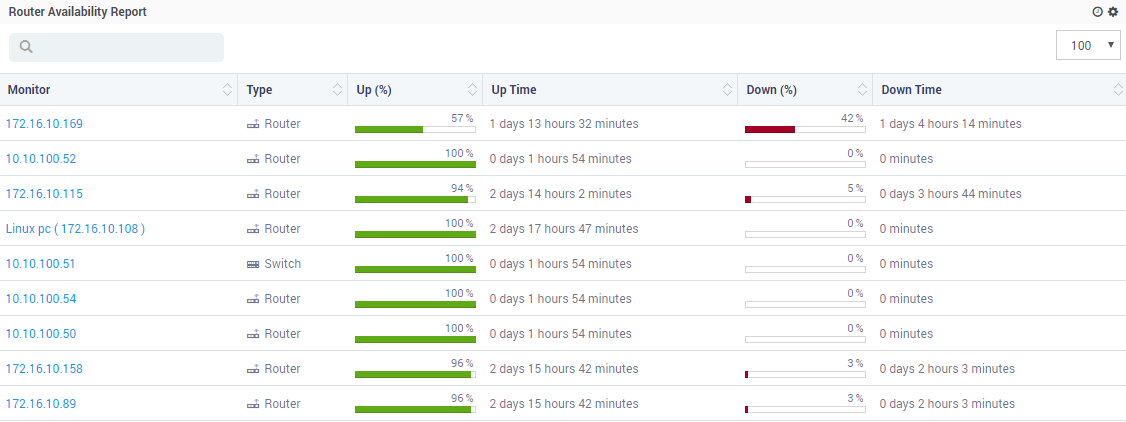
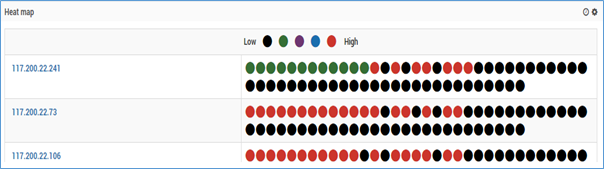
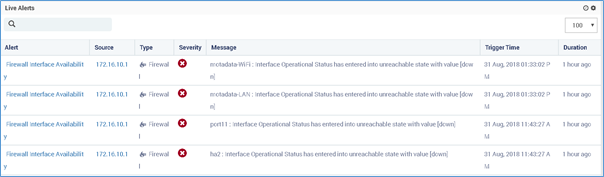
Grid widgets are showing the all network devices data as List view or Grid view.
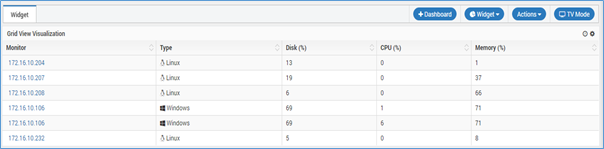
Grid View
A parameter of flap history has been introduced in the grid view. If flap history is ‘yes’, a grid view showing the duration of each severity the monitor has been in individually will be generated and if ‘no’, a grid view showing the total duration of each severity the monitor has been in will be generated.
Flap History Yes View
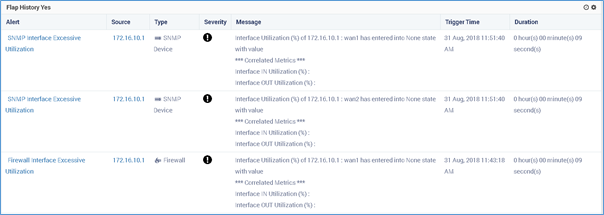
Flap History Yes View
Flap History No View
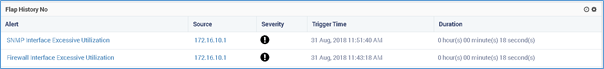
Flap History No View
Widget Settings
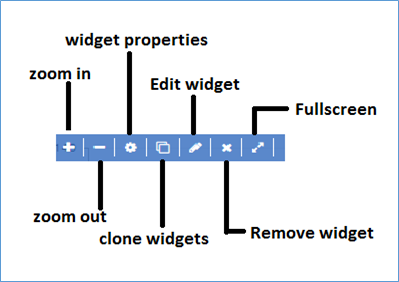
Widget Options
Zoom in You may get zoomed in view of the widget.
Zoom out You may get zoomed out view of the widget.
Widget Properties
The options in widget properties vary with type of widget. Use the information as applicable in the widget.
Visualization Layout: You may set visualization layout as per your requirement for widget counts for the single row. User can set for the 1 to 6 counts.
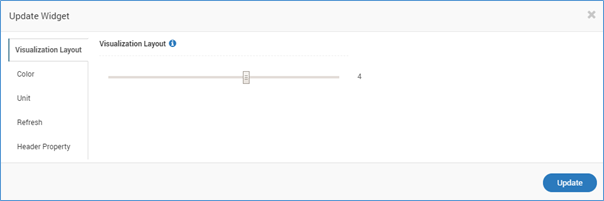
Update Widget - Visualization Layout
Color: Customize the colors based on the conditions you apply.
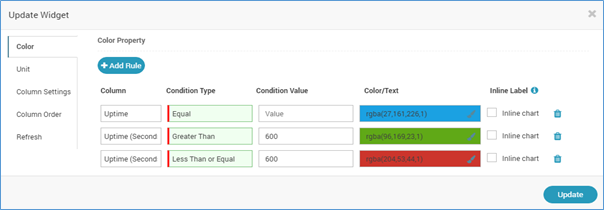
Manage Widget Colors
Unit: Change the unit of the values
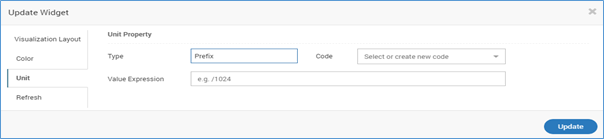
Unit of the Values in Widget
Custom Settings: You may change the column settings by customizing the width of the column and by hiding few columns.
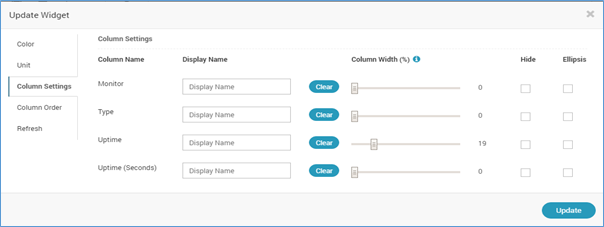
Custom Settings
Column Order: Change the order of columns using drag and drop.
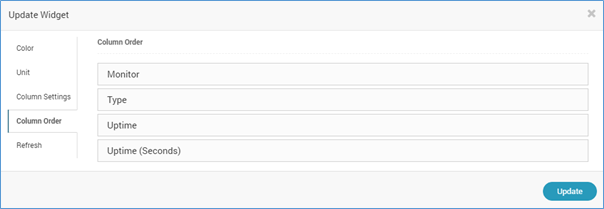
Column Order
Refresh: Set the refresh rate.
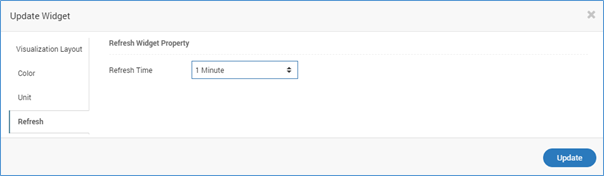
Set Refresh Rate
Extra Column: [ONLY FOR Metric, Availability and Alert Widgets. This is visible when you update the Grid or Top N/Least N view of widgets.] You can select the extra columns (dependent on widget) to show in the widget table.
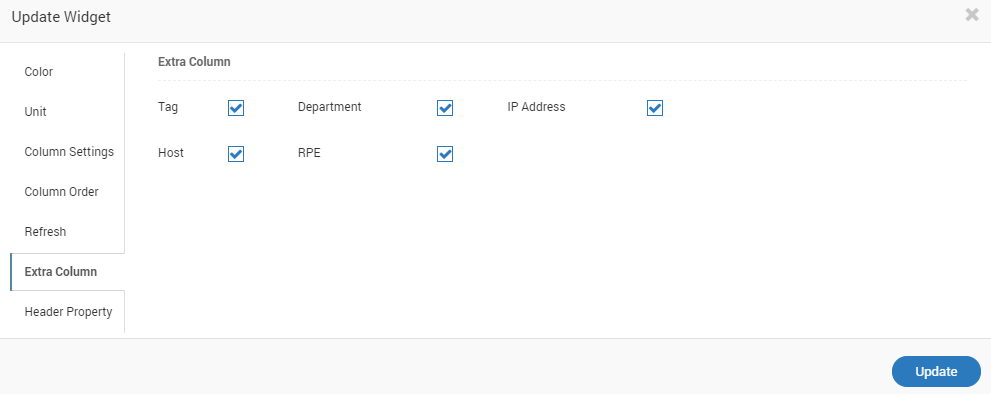
Extra columns
Header Property: modify widget header property from given options
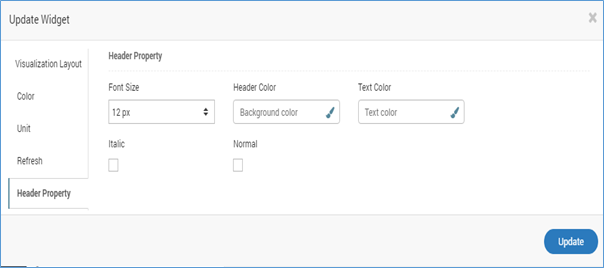
Header Property
Header Property Sample Output
Clone Widget
The option will copy the same widget and its properties or conditions.
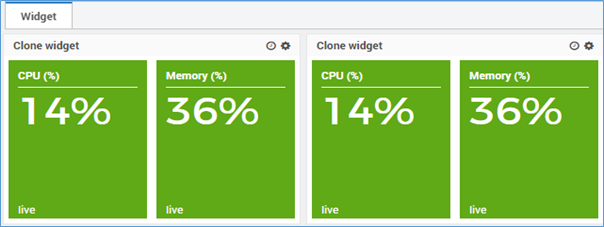
Clone Widget
The user can place the same widget at Dashboard or Report.
The user can select the sub categories options and place the same widget at the dashboard or report location.
Edit Widget
You may edit the widget and configure its fields.
Remove Widget
You may delete the widget.
Full screen
You may go full screen of the widget.
Additional Read - Time Range
The time range in a widget lets you filter the data based on the polling time. When you select a time range, Motadata will show only that data which is polled in that duration.
What is Polling Time?
There is difference between polling time and event time. For widgets we use polling time.
Event Time: The time on which event happened.
Poll Time: The time on which Motadata received the data.
How Time Range Works?
In every 5 minutes, Motadata polls the monitor and collects the data.
System stores the data and timestamp when the monitor is polled.
When the timestamp of data falls in the time range of metric, Motadata shows data as output.
To understand what exactly you’ll see look at the time range value while creating the widget.
Select Time Range
Basic Time Range
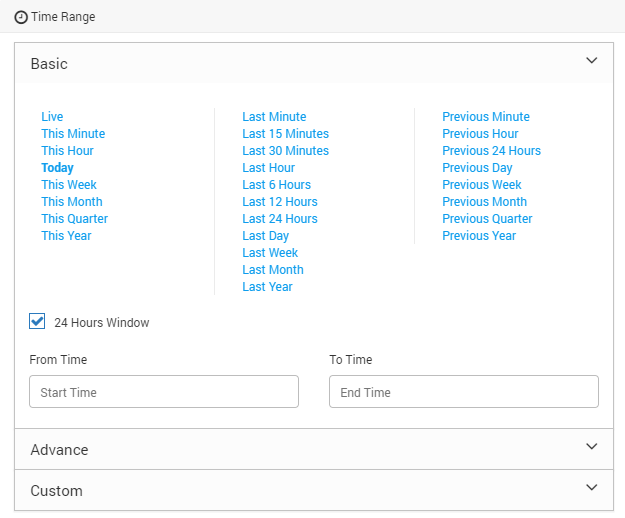
Basic Time Range
Time Range |
Description |
Live |
Shows only last polled data. |
Minute |
Shows all the data of 1 minute |
Hour |
Shows all the data of 1 hour |
Today |
Shows all the today’s data |
Week |
Shows all the data of 1 week |
Month |
Shows all the data of 1 month |
Quarter |
Shows all the data of 1 quarter |
Year |
Shows all the data of 1 year |
What does ‘This’ mean in Time Range?
Here, the time range computed is for the time of current hour or current month or current day. It doesn’t count the full time range but uses standard start time and computes till the current time. See following example to understand:
Your current time is: 05 April 2019 15:23:42
Time Range |
Description |
This Minute |
15:23:00 - 15:23:59 (Current minute) |
This Hour |
15:00:00 - 15:59:59 (Current hour) |
Today |
05 April 2019 00:00:00 - 23:59:59 (Present day) |
This Week |
01 April 2019 00:00:00 - 07 April 2019 23:59:59 (Current week starts from Monday) |
This Month |
01 April 2019 00:00:00 - 30 April 2019 23:59:59 (Current Month) |
This Quarter |
01 Apr, 2019 00:00:00 - 30 Jun, 2019 23:59:59 (Current Quarter) |
This Year |
01 Jan, 2019 00:00:00 - 31 Dec 2019 23:59:59 (Current Year) |
What does ‘Last’ mean in Time Range?
Here, the time range computed is the complete duration starting at some point and ending at current time. It sets the start time by computing the current time and the required time duration. See following example to understand:
Your current time is: 05 April 2019 15:23:42
Time Range |
Description |
Last Minute |
15:22:42 - 15:23:42 (Last 1 minute) |
Last 15 Minutes |
15:04:00 - 15:23:42 (Last 15 minutes when counted using minutes. Seconds are not considered) |
Last 30 Minutes |
15:53:00 - 15:23:42 (Last 30 minutes when counted using minutes. Seconds are not considered) |
Last Hour |
14:23:42 - 15:23:42 (Last 1 hour) |
Last 6 Hours |
10::00:00 - 15:23:42 (Last 6 hours when counted using hours. Minutes and seconds are not considered) |
Last 12 Hours |
04:00:00 - 15:23:42 (Last 12 hours when counted using hours. Minutes and seconds are not considered) |
Last 24 Hours |
04 Apr 2019 16:00:00 - 05 Apr 2019 15:23:42 (Last 24 hours when counted using hours. Minutes and seconds are not considered) |
Last Day |
04 Apr 2019 15:23:42 - 05 Apr 2019 15:23:42 (Last 1 day) |
Last Week |
29 Mar 2019 15:23:42 - 05 Apr 2019 15:23:42 (Last 1 week) |
Last Month |
05 Mar 2019 15:23:42 - 05 Apr 2019 15:23:42 (Last 1 month) |
Last Year |
05 Apr 2018 15:23:42 - 05 Apr 2019 15:23:42 (Last 1 year) |
What does ‘Previous’ mean in Time Range?
Here, the time range computed is for the time of previous hour or previous month or previous day. It counts the full time range and uses standard start time and standard end time. See following example to understand:
Your current time is: 05 April 2019 15:23:42
Time Range |
Description |
Previous Minute |
15:22:00 - 15:23:00 (Previous 1 minute) |
Previous Hour |
14:00:00 - 14:59:59 (Previous 1 hour) |
Previous 24 Hours |
04 Apr 2019 16:00:00 - 05 Apr 2019 15:00:00 (Previous 24 hours) |
Previous Day |
04 Apr 2019 00:00:00 - 04 Apr 2019 23:59:59 (Previous 1 day) |
Previous Week |
25 Mar 2019 00:00:00 - 31 Mar 2019 23:59:59 (Previous 1 week) |
Previous Month |
01 Mar 2019 00:00:00 - 31 Mar 2019 23:59:59 (Previous 1 month) |
Previous Quarter |
01 Mar 2019 00:00:00 - 30 Mar 2019 23:59:59 (Previous Quarter) |
Previous Year |
01 Jan 2018 00:00:00 - 31 Dec 2019 23:59:59 (Previous 1 year) |
Advance Time Range
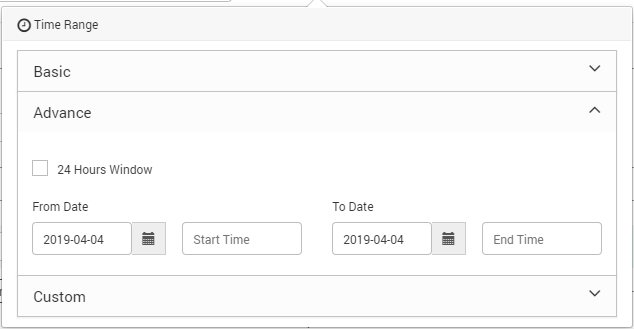
Advance Time Range
You can select the specific start date-time and end date-time. This time range does not consider seconds of the polling seconds. Here, the seconds will always be 00.
Custom Time Range
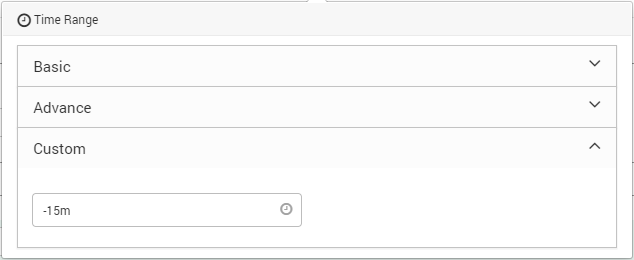
Custom Time Range
The format of acceptable values in this field is:
-(whole number)x
For seconds, x is s. (E.g. -10s. Shows data of last 10 seconds)
For minutes, x is m. (E.g. -10m. Shows data of last 10 minutes)
For hours, x is h. (E.g. -10h. Shows data of last 10 hours)
For days, x is d. (E.g. -10d. Shows data of last 10 days)
For week, x is w. (E.g. -10w. Shows data of last 10 weeks)
For month, x is M. (E.g. -10M. Shows data of last 10 months)
For year, x is y. (E.g. -10y. Shows data of last 10 years)